Industry News · Games market statistics
Video Game Industry Statistics 2026: Market Size, Players, Revenue and Jobs
Americans spent $60.8 billion on video games in 2025, the second-highest year on record after 2021’s $61.7 billion, and 212.3 million Americans play at least an hour a week. The biggest companies report record game revenue: Tencent RMB241.6 billion, Sony ¥4.69 trillion, Microsoft’s Xbox $21.8 billion. No free first-party source measures the global market as a whole.
Key takeaways
- US consumer spending on video games reached $60.8 billion in 2025 (restated from $60.7 billion), up about 1.5% and second only to 2021’s $61.7 billion; it was $11.7 billion in 2002.
- Content is 86% of US spending: $52.4 billion of the $60.8 billion, with subscriptions up 20% and mobile alone worth $26.7 billion, while hardware rose 9% to $5.4 billion on the Nintendo Switch 2 launch.
- 212.3 million Americans aged 5 to 90 play video games at least an hour a week, 67% of the population; the average player is 37 and 29% of players are 50 or older.
- Among the largest game companies, Tencent made RMB241.6 billion from games in 2025, Sony ¥4,685.7 billion in its game segment and Microsoft $21.8 billion from Xbox in fiscal 2026 (−7%), while Nintendo’s sales doubled to ¥2,313.1 billion with the Switch 2.
- Digital is now almost all of the business at big publishers: 97.0% of Take-Two’s revenue came through digital channels, and 81% of EA’s console game units were sold digitally.
- The US industry employs 82,930 people directly and supports 250,838 jobs and $95.8 billion of economic output in total, with 44% of direct jobs in California.
Key figures
$60.8 billion
total US consumer spending on video games in 2025, the second-highest year on record
Restated in March 2026 from the $60.7 billion first published on 11 February 2026; up from $59.9 billion in 2024. Covers content, hardware and accessories.
212.3 million
Americans aged 5 to 90 who play video games at least one hour a week
Up from 205.1 million in the 2025 report and 190.6 million in 2024; the 2023 report counted 212.6 million.
37 years
average age of an American video game player
Up from 36 in the 2024 and 2025 reports and 33 in 2022.
$26.7 billion
US consumer spending on mobile games in 2025, up 1%
A Sensor Tower figure quoted in the ESA release; it is part of the $52.4 billion content total, so mobile is about half of all US content spending.
RMB241.6 billion
Tencent’s 2025 games revenue: RMB164.2 billion domestic (+18%) and RMB77.4 billion international (+33%)
The total is our sum of Tencent’s two reported lines. International games revenue passed US$10 billion for the first time.
¥4,685.7 billion
Sony Game & Network Services (PlayStation) sales, essentially flat year on year
Operating income was a record ¥463.3 billion despite a ¥120.1 billion Bungie impairment.
250,838
US jobs created and supported by the video game industry, including suppliers and spending by workers
Each direct job supports 2.02 more in the wider economy (TEConomy model for the ESA).
$55 billion
enterprise value of the take-private of Electronic Arts by PIF, Silver Lake and Affinity Partners
Announced 29 September 2025 at $210 a share in cash; completed on 4 August 2026, when EA left Nasdaq. EA called it the largest all-cash sponsor take-private in history.
How big is the video game industry in the US?
$60.8 billion
total US consumer spending on video games in 2025, the second-highest year on record
Restated in March 2026 from the $60.7 billion first published on 11 February 2026; up from $59.9 billion in 2024. Covers content, hardware and accessories.
$61.7 billion
US video game spending in 2021, the all-time record
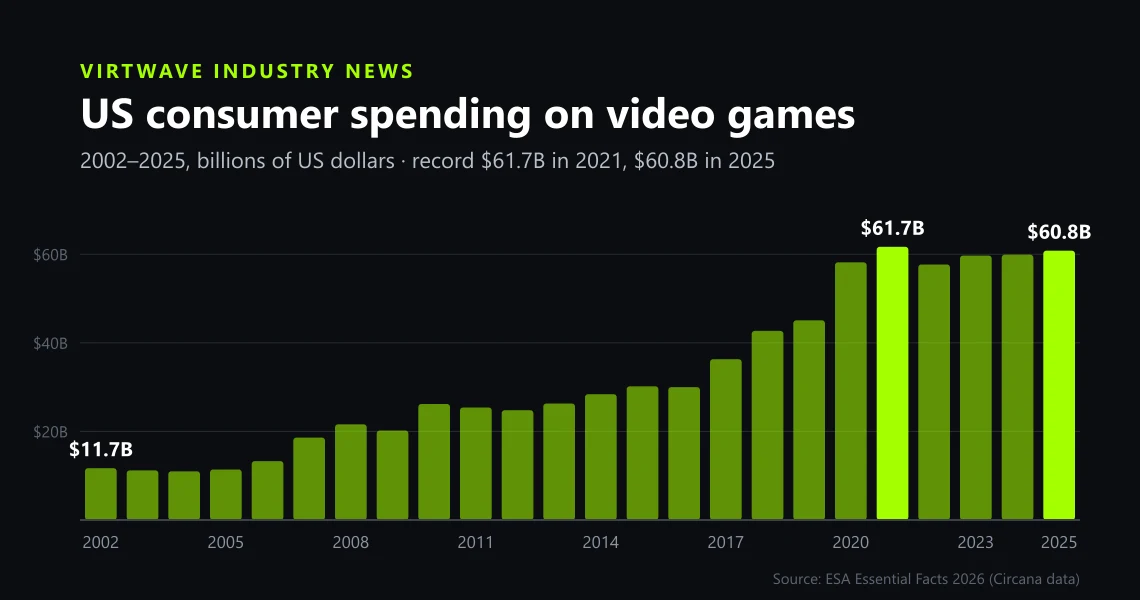
The pandemic peak; spending fell to $57.7 billion in 2022 and has climbed back each year since.
5.2×
growth in annual US video game spending since 2002 ($11.7 billion to $60.8 billion)
Our ratio from the ESA’s 2002–2025 series, in nominal dollars (not adjusted for inflation), and the measurement has widened over time to take in digital and mobile spending.
$52.4 billion
US spending on video game content in 2025: full games, DLC, in-game purchases and subscriptions
Restated from $52.3 billion; up from $51.7 billion in 2024. Content is about 86% of total spending.
+20%
growth in US consumer spending on video game subscription services in 2025
The fastest-growing category named in the ESA release; the dollar amount was not published.
$26.7 billion
US consumer spending on mobile games in 2025, up 1%
A Sensor Tower figure quoted in the ESA release; it is part of the $52.4 billion content total, so mobile is about half of all US content spending.
$5.4 billion
US spending on video game hardware in 2025, up 9% from $4.9 billion
The year the Nintendo Switch 2 launched (June 2025).
$2.9 billion
US spending on video game accessories in 2025, down 7% from $3.2 billion
First published as $2.95 billion; restated to $2.9 billion.
US consumer spending on video games, 2002–2025
Source: Entertainment Software Association — 2026 Essential Facts About the U.S. Video Game Industry (PDF)
| Category | 2024 | 2025 | Change |
|---|---|---|---|
| Content (games, DLC, in-game, subscriptions) | $51.7B | $52.4B | +1% |
| of which mobile | n/a | $26.7B | +1% |
| Hardware | $4.9B | $5.4B | +9% |
| Accessories | $3.2B | $2.9B | −7% |
| Total | $59.9B | $60.8B | +1.5% |
2025 figures are the March 2026 restatement; the first release said $60.7 billion total, $52.3 billion content and $2.95 billion accessories, +1.4% overall. The total change is our calculation on the restated figure.
US spending on games has moved in a narrow band since the pandemic: a record $61.7 billion in 2021, a dip to $57.7 billion in 2022, then three years of small gains to $60.8 billion in 2025. The mix is changing more than the total. Subscriptions grew 20% in 2025 and hardware 9% on the Switch 2 launch, while accessories fell 7%. Mobile, at $26.7 billion, is roughly half of all content spending. What these numbers do not say is how much was spent on PC storefronts outside Circana’s panel, or what happened after inflation: in real terms, 2025 spending is below 2021.[2][1]
Which video game companies make the most money?
RMB241.6 billion
Tencent’s 2025 games revenue: RMB164.2 billion domestic (+18%) and RMB77.4 billion international (+33%)
The total is our sum of Tencent’s two reported lines. International games revenue passed US$10 billion for the first time.
+17%
growth in Tencent’s domestic games revenue in April–June 2026, to RMB47.3 billion
International games revenue was RMB18.6 billion, down 0.8% because of currency moves (up 4% in constant currency).
¥4,685.7 billion
Sony Game & Network Services (PlayStation) sales, essentially flat year on year
Operating income was a record ¥463.3 billion despite a ¥120.1 billion Bungie impairment.
+13.9%
growth in Sony’s PlayStation network services sales (PS Plus and other services), to ¥763.1 billion
Our percentage from Sony’s figures; hardware and others fell 12.1% to ¥1,391.6 billion, while digital software and add-ons rose 5.4% to ¥2,415.3 billion.
$21.79 billion
Microsoft Xbox revenue, down 7% from a record $23.46 billion
Hardware plus content and services, including Activision Blizzard.
RMB92.1 billion
NetEase games and related services revenue (US$13.2 billion), up from RMB83.6 billion
About 10% growth by our calculation; online games were 97.3% of the segment.
¥2,313.1 billion
Nintendo net sales, up 98.6% and a company record
The first year of Nintendo Switch 2, which sold 19.86 million units in the period. Digital sales rose 25.0% to ¥407.6 billion.
$7.53 billion
Electronic Arts net revenue, up 1%; net bookings were $8.03 billion (+9%)
Live services and other were $5,383 million, 71% of revenue. EA’s last annual report as a listed company.
$6.66 billion
Take-Two net revenue, up 18.2%; net bookings were $6.72 billion (+19%)
Mobile was 50.1% of net revenue and console 39.0%.
$4.89 billion
Roblox revenue, up 36%; bookings were $6.79 billion
Bookings rose from $4.37 billion in 2024. 82% of Roblox daily users are outside the US and Canada.
¥195.4 billion
Capcom net sales, up 15.2%, with a record 59.07 million games sold
A ninth straight year of record profit at every level; Capcom forecasts ¥210.0 billion for the year to March 2027.
€1.53 billion
Ubisoft net bookings, down 17.4% from €1.85 billion
IFRS sales fell 21.8% to €1,395.7 million; Ubisoft had 36 million monthly active users on console and PC.
| Company | Period | Game revenue reported | Change |
|---|---|---|---|
| Tencent (domestic + international games) | Year to Dec 2025 | RMB241.6B | +22%* |
| Sony (Game & Network Services) | Year to Mar 2026 | ¥4,685.7B | Flat |
| Nintendo (net sales) | Year to Mar 2026 | ¥2,313.1B | +98.6% |
| Microsoft (Xbox) | Year to Jun 2026 | $21.79B | −7% |
| NetEase (games and related services) | Year to Dec 2025 | RMB92.1B (US$13.2B) | +10%* |
| Electronic Arts (net revenue) | Year to Mar 2026 | $7.53B | +1% |
| Take-Two (net revenue) | Year to Mar 2026 | $6.66B | +18.2% |
| Roblox (revenue) | Year to Dec 2025 | $4.89B | +36% |
| Ubisoft (net bookings) | Year to Mar 2026 | €1.53B | −17.4% |
| Capcom (net sales) | Year to Mar 2026 | ¥195.4B | +15.2% |
* Our calculation from the two years the company reports. Tencent’s total is our sum of its domestic and international games lines. Sony and Nintendo include hardware; Nintendo and Capcom figures cover the whole company, nearly all of it games.
Source: Tencent Holdings — Tencent 2025 Annual Report (PDF); Sony Group (SEC EDGAR) — Sony Group Form 20-F for the fiscal year ended 31 March 2026 (filed 18 June 2026); Nintendo — Nintendo Consolidated Financial Highlights, fiscal year ended 31 March 2026 (PDF, 8 May 2026); Microsoft (SEC EDGAR) — Microsoft Form 10-K for the fiscal year ended 30 June 2026; NetEase (SEC EDGAR) — NetEase Announces Fourth Quarter and Fiscal Year 2025 Unaudited Financial Results (Form 6-K, Exhibit 99.1); Electronic Arts (SEC EDGAR) — Electronic Arts Form 10-K for the fiscal year ended 31 March 2026; Take-Two Interactive (SEC EDGAR) — Take-Two Interactive Form 10-K for the fiscal year ended 31 March 2026 (filed 22 May 2026); Roblox (SEC EDGAR) — Roblox Form 10-K for the year ended 31 December 2025; Ubisoft — Ubisoft Reports Full-Year 2025-26 Earnings Figures (press release PDF); Capcom — Capcom consolidated earnings for the year ended March 2026 (press release PDF, 13 May 2026)
The largest game businesses are not all game companies. Tencent’s games revenue of RMB241.6 billion sits inside a social media and payments group, and Sony and Microsoft both run games as one division among several. Growth in the latest year came from new hardware and big releases: Nintendo’s sales doubled with the Switch 2, Take-Two grew 18% on NBA 2K26, Borderlands 4 and its mobile games, and Roblox grew 36%. Ubisoft fell 17% on a thin release slate and Xbox fell 7% as console hardware shrank. What this table does not show is profit: Sony’s game segment made a record ¥463.3 billion of operating income, while Ubisoft reported a large operating loss.[8][16][18][17][22][11][10]
How many people play video games?
212.3 million
Americans aged 5 to 90 who play video games at least one hour a week
Up from 205.1 million in the 2025 report and 190.6 million in 2024; the 2023 report counted 212.6 million.
67%
share of the US population who play video games one hour a week or more
More than two in three Americans, on any platform.
37 years
average age of an American video game player
Up from 36 in the 2024 and 2025 reports and 33 in 2022.
29%
of American players are 50 or older, the same share as 18–34-year-olds
21% are under 18 and 20% are 35–49.
53% / 46%
male and female shares of American players
1% are non-binary or preferred not to say.
84% vs 63%
share of American children (5–17) and adults (18–90) who play at least an hour a week
By generation: Alpha 83%, Gen Z 82%, Millennials 71%, Gen X 56%, Boomers 50%, Silent Generation 32%.
75%
of American parents play video games
81% of parents who play say they play with their children.
Americans who play video games, by ESA report year
Source: Entertainment Software Association — 2022 Essential Facts About the U.S. Video Game Industry (PDF); Entertainment Software Association — 2023 Essential Facts About the U.S. Video Game Industry (PDF); Entertainment Software Association — 2024 Essential Facts About the U.S. Video Game Industry (PDF); Entertainment Software Association — Annual ESA Study Reveals Video Games’ Universal Appeal Across Generations (3 Jun 2025); Entertainment Software Association — 2026 Essential Facts About the U.S. Video Game Industry (PDF)
Age of American video game players, 2026
Source: Entertainment Software Association — 2026 Essential Facts About the U.S. Video Game Industry (PDF)
About two in three Americans play, and the average player is now 37, up from 33 in the 2022 report. Children still play most (84% of 5–17-year-olds against 63% of adults), but players aged 50 and over are as large a group as 18–34-year-olds. The count itself moves around: 190.6 million in the 2024 report, 212.3 million in 2026. That swing says more about survey sampling than about millions of people starting or stopping, and the ESA does not publish a margin of error.[1][4][6]
Which platforms and genres do people play?
83%
of US households played on at least one video game device in the past 12 months
73%
of US households play on mobile, the most common platform
Against 52% on PC, 44% on console and 10% in virtual reality.
59%
of American players aged 8+ regularly play puzzle games, the most popular genre
Followed by arcade (46%), action (43%) and shooters (37%).
6,761
ESRB age ratings assigned in 2025, 90% of them E, E10+ or T
Covers boxed games and downloadable console titles.
| Platform | Share of US households |
|---|---|
| Mobile | 73% |
| PC | 52% |
| Console | 44% |
| Virtual reality | 10% |
Source: Entertainment Software Association — 2026 Essential Facts About the U.S. Video Game Industry (PDF)
Genres American players play regularly, 2026
Source: Entertainment Software Association — 2026 Essential Facts About the U.S. Video Game Industry (PDF)
Mobile is the default platform: almost three in four US households play on a phone or tablet, against 44% on a console. Puzzle games top the genre list, played by 74% of Boomer and Silent Generation players, while shooters (50% of male players against 23% of female players) and action games skew young and male. These are shares of people, not of money or hours, so they do not say that console and PC matter less to the business: the full-game chart of the year’s top sellers is all console and PC titles such as Battlefield 6, NBA 2K26 and Call of Duty.[1][2]
Digital, subscriptions and in-game purchases
58%
of American players aged 8+ have ever bought in-game content
In-game currency is the most common purchase (34%), then skins (27%), battle passes (26%) and expansions (26%). Gen Z leads at 78%.
35%
of American players aged 8+ bought a game subscription in the past 12 months
25% a console online membership, 18% a gaming library service and 10% a title-specific subscription.
33% vs 24%
of American players aged 8+ bought a digital copy vs a physical copy of a game in the past year
58% downloaded a free game; 43% bought a game in any form.
97.0%
of Take-Two’s net revenue came through digital online channels
Up from 96.4% a year earlier; physical retail was 3.0%. Recurrent consumer spending (in-game purchases, add-ons, ads) was 78.1% of revenue.
81%
of EA’s full-game units on PlayStation and Xbox were sold digitally
Up from 78% and 73% in the two previous years. EA’s digital full-game revenue was $1,708 million against $440 million from packaged goods.
How American players got games in the past 12 months
Source: Entertainment Software Association — 2026 Essential Facts About the U.S. Video Game Industry (PDF)
- Take-Two: 97.0% of net revenue through digital channels and 78.1% from recurrent consumer spending in the year to March 2026.
- Electronic Arts: 81% of console full-game units sold digitally; live services 71% of net revenue.
- Nintendo: digital sales of ¥407.6 billion, up 25.0%, in the year to March 2026.
- Sony: digital software and add-on content ¥2,415.3 billion, 53% of PlayStation segment sales to customers by our calculation.
The free game is the most common way in: 58% of American players downloaded one in the past year, and 58% have bought something inside a game. At the publisher level, physical sales are now a rounding error for some (3% of Take-Two’s revenue) and a shrinking share for others (EA’s packaged revenue fell to $440 million). Subscriptions are the growth story in US spending, up 20% in 2025. What these figures do not say is how much of digital revenue platform holders keep: Sony and Microsoft alone accounted for 39% and 16% of EA’s net revenue as storefronts.[1][18][13][2]
What were the best-selling games of 2025 in the US?
Battlefield 6
the top-grossing console and PC game in the US in 2025
Ahead of NBA 2K26 and Borderlands 4; Circana ranking published by the ESA.
MONOPOLY GO!
the top-grossing mobile game in the US in 2025
Ahead of Royal Match and Last War: Survival; Sensor Tower ranking published by the ESA. Roblox placed eighth.
| Rank | Console & PC full game | Mobile game |
|---|---|---|
| 1 | Battlefield 6 | MONOPOLY GO! |
| 2 | NBA 2K26 | Royal Match |
| 3 | Borderlands 4 | Last War: Survival |
| 4 | Monster Hunter: Wilds | Candy Crush Saga |
| 5 | Call of Duty: Black Ops 7 | Whiteout Survival |
| 6 | Madden NFL 26 | Township |
| 7 | EA Sports College Football 26 | Clash Royale |
| 8 | EA Sports FC 26 | Roblox |
| 9 | The Elder Scrolls IV: Oblivion Remastered | Coin Master |
| 10 | Call of Duty: Black Ops 6 | Gossip Harbor: Merge & Story |
Circana’s full-game chart covers dollar sales in the US and does not include every digital storefront or Nintendo’s first-party digital sales.
Battlefield 6 finished ahead of both Call of Duty games in the US in 2025: Black Ops 7 placed fifth and the previous year’s Black Ops 6 tenth. EA had four of the top ten (Battlefield 6, Madden NFL 26, College Football 26 and FC 26). The mobile chart is made up entirely of free-to-play games that earn from in-app purchases. The list ranks dollar sales, not players, so a free game with a huge audience but lower spending can miss it.[2]
Deals and the release calendar
$55 billion
enterprise value of the take-private of Electronic Arts by PIF, Silver Lake and Affinity Partners
Announced 29 September 2025 at $210 a share in cash; completed on 4 August 2026, when EA left Nasdaq. EA called it the largest all-cash sponsor take-private in history.
19 November 2026
release date of Grand Theft Auto VI, as restated by Take-Two in August 2026
Take-Two guides to record net bookings of $8.0–$8.2 billion for the year to March 2027 on the back of it.
225 million+
units of Grand Theft Auto V sold in since 2013; the series has sold in more than 465 million
Sell-in to retailers and digital storefronts, not sell-through to players.
€1.16 billion
cash Ubisoft received when its strategic transaction with Tencent closed
Ubisoft says it used it to cut non-IFRS net debt from €885 million to €187 million at 31 March 2026.
- 29 September 2025: EA agrees to be acquired by PIF, Silver Lake and Affinity Partners at $210 a share, an enterprise value of about $55 billion.
- 4 August 2026: the EA take-private completes and EA shares stop trading on Nasdaq.
- Year to March 2026: Ubisoft closes its strategic transaction with Tencent and receives €1.16 billion in cash.
- 19 November 2026: Grand Theft Auto VI release date, confirmed in Take-Two’s August 2026 quarterly report.
The biggest change in the industry’s structure this year is that Electronic Arts, one of the largest Western publishers, is no longer a public company, so its fiscal 2026 10-K is likely its last detailed public report. The biggest event in the calendar is Grand Theft Auto VI on 19 November 2026: Take-Two expects it to lift net bookings to $8.0–$8.2 billion, about a fifth above fiscal 2026. GTA V alone has sold in more than 225 million units since 2013. What the guidance does not say is how many copies of GTA VI Take-Two expects to sell.[15][13][20][18]
How many jobs does the video game industry create?
82,930
people directly employed by the US video game industry
Across 8,998 sites and locations; the game software sector alone employs more than 63,000.
250,838
US jobs created and supported by the video game industry, including suppliers and spending by workers
Each direct job supports 2.02 more in the wider economy (TEConomy model for the ESA).
$95.8 billion
total economic output generated and supported by the US video game industry
Including $33.5 billion in wages and benefits and $12.7 billion in tax revenue.
$65.5 billion
contribution of the US video game industry to US GDP
44%
of US video game industry jobs are in California (more than 36,000)
California, Washington, Texas, New York and Florida together hold 74%; remote workers are 17% (14,461 jobs).
| Measure | Value |
|---|---|
| Direct industry employment | 82,930 |
| Total employment supported | 250,838 |
| Total wages and benefits | $33.5 billion |
| Total economic output | $95.8 billion |
| Contribution to US GDP | $65.5 billion |
| Total tax revenues | $12.7 billion |
| Sites and locations | 8,998 |
Total impacts come from an IMPLAN input-output model run by TEConomy Partners for the ESA; a chart in the report prints 250,968 total jobs, while the text says 250,838 — we use the text figure.
The US game industry is a mid-sized employer, about 83,000 direct jobs, heavily concentrated in California and four other states. Its economic footprint is larger because each job supports about two more elsewhere, which is how the ESA arrives at 250,838 jobs and $95.8 billion of output. These totals come from a model, not a count, and are published by the industry’s own trade body. Company employment data was collected in November and December 2025, so the figures do not reflect any hiring or layoffs since.[7]
Methodology and caveats
Every figure was read by our team on 17 October 2026 from the document cited next to it: the ESA’s 2026 Essential Facts booklet, its earlier Essential Facts reports (2022–2025), its 11 February 2026 spending release and its 2026 Economic Impact Report, and the annual filings or results releases of Tencent, Sony, Microsoft, NetEase, Electronic Arts, Nintendo, Roblox, Take-Two, Capcom and Ubisoft. No statistics aggregator sites were used.
Figures in the Essential Facts booklet are printed inside charts that do not survive text extraction, so we rendered the pages to images and read the numbers by eye. Company figures are taken in their reporting currency and fiscal year; we do not convert currencies. Where we added, divided or compared figures ourselves, the detail says “our calculation”.
We will update this page when the ESA publishes 2026 spending (around February 2027) and the 2027 Essential Facts, and after each company’s next annual results, and log the changes in the update history.
- US spending figures come from Circana (console, PC, hardware, accessories) and Sensor Tower (mobile) via the ESA; they are panel-based estimates, not a census of every sale, and Circana does not track every digital storefront.
- ESA player figures come from a YouGov online survey of 13,545 respondents in February 2026, weighted to the US population. The question wording and age range have changed between editions, so the year-by-year player counts are not strictly comparable.
- The ESA is the trade association of the US video game industry, and its Economic Impact Report is commissioned research based on a model; we mark ESA sources as third-party.
- Company figures cover different fiscal years (calendar 2025, or years ending March or June 2026), different metrics (revenue, net sales, net bookings) and in some cases hardware or non-game business. They are not a ranking of game revenue on a like-for-like basis.
- Spending figures are in nominal dollars. Adjusted for inflation, 2025 US spending is below the 2021 peak.
- No global games market total is given because none is published free by a first-party or government source.
How we research and correct our content is set out in our editorial policy.
Video Game Industry Statistics 2026: FAQ
How big is the video game industry in 2026?
In the US, consumers spent $60.8 billion on video games in 2025, the second-highest year on record after $61.7 billion in 2021, according to the ESA with Circana and Sensor Tower. No free first-party source measures the global market; the largest company, Tencent, alone made RMB241.6 billion from games in 2025.
How many people play video games in the US?
The ESA’s 2026 Essential Facts report says 212.3 million Americans aged 5 to 90 play video games at least an hour a week, which is 67% of the population. The figure was 205.1 million in the 2025 report and 190.6 million in 2024.
What is the average age of a gamer?
The average American video game player is 37 years old, according to the ESA’s 2026 Essential Facts report, up from 36 in 2024 and 2025. Players aged 50 and over make up 29% of all players, the same share as 18–34-year-olds.
How much do Americans spend on mobile games?
Americans spent $26.7 billion on mobile games in 2025, up 1%, according to Sensor Tower data published by the ESA. That is about half of the $52.4 billion spent on all video game content in the US.
What is the biggest video game company by revenue?
Tencent reported the largest games revenue: RMB241.6 billion in 2025 (RMB164.2 billion domestic and RMB77.4 billion international). Sony’s PlayStation segment had ¥4,685.7 billion of sales in the year to March 2026, and Microsoft’s Xbox $21.79 billion in the year to June 2026. Fiscal years and currencies differ, so the ranking is approximate.
How many jobs are in the video game industry?
The US video game industry directly employed 82,930 people in 2025 and supported 250,838 jobs in total, according to the ESA’s 2026 Economic Impact Report. 44% of the direct jobs are in California.
What was the best-selling video game of 2025?
Battlefield 6 was the top-grossing console and PC game in the US in 2025, ahead of NBA 2K26 and Borderlands 4, according to Circana data published by the ESA. MONOPOLY GO! was the top-grossing mobile game.
Is the video game industry growing?
Slowly. US spending grew about 1.5% in 2025 to $60.8 billion, still below the 2021 peak. Results were mixed at the big companies: Nintendo’s sales doubled with the Switch 2 and Take-Two grew 18%, while Xbox revenue fell 7% and Ubisoft’s net bookings 17%.
Cite or reuse these statistics
Every figure in this report is free to reuse in articles, videos, research and AI-written content under CC BY 4.0. The one condition: credit Virtwave with a link to this page, so your readers can check the number and see when it was last updated.
https://www.virtwave.com/industry-news/video-game-industry-statistics<a href="https://www.virtwave.com/industry-news/video-game-industry-statistics">Video Game Industry Statistics 2026 (Virtwave)</a>Haddad, N. (2026). Video Game Industry Statistics 2026. Virtwave. https://www.virtwave.com/industry-news/video-game-industry-statisticsSources
- Entertainment Software Association2026 Essential Facts About the U.S. Video Game Industry (PDF)Accessed — YouGov survey, 11–25 Feb 2026, 13,545 respondents. 212.3M players, 67%, average age 37, age and gender split, platforms, genres, purchases, ESRB ratings, and the 2002–2025 US sales chart (Circana). Pages rendered to images and read by eye.
- Entertainment Software Association2025 U.S. Consumer Spending on Video Games Nears Pandemic-Level Peak at $60.7 Billion (11 Feb 2026, updated)Accessed — Circana and Sensor Tower data. Restated totals: $60.8B, content $52.4B, hardware $5.4B, accessories $2.9B; subscriptions +20%; mobile $26.7B; 2021 record $61.7B; top-10 console/PC and mobile games.
- Entertainment Software AssociationAnnual ESA Study Reveals Video Games’ Universal Appeal Across Generations (3 Jun 2025)Accessed — 2025 Essential Facts: 205.1M Americans play; average age 36.
- Entertainment Software Association2024 Essential Facts About the U.S. Video Game Industry (PDF)Accessed — 190.6M Americans play; average player 36.
- Entertainment Software Association2023 Essential Facts About the U.S. Video Game Industry (PDF)Accessed — 212.6M Americans play every week.
- Entertainment Software Association2022 Essential Facts About the U.S. Video Game Industry (PDF)Accessed — 215.5M active players; average age 33.
- Entertainment Software Association (TEConomy Partners)2026 Economic Impact Report: The U.S. Video Game Industry (PDF)Accessed — 82,930 direct jobs at 8,998 sites; 250,838 total jobs; $33.5B wages; $95.8B output; $65.5B GDP; $12.7B taxes; California 44%.
- Tencent HoldingsFirst-partyTencent 2025 Annual Report (PDF)Accessed — Domestic Games RMB164.2B (+18%); International Games RMB77.4B (+33%, 32% constant currency), surpassing US$10B.
- Tencent HoldingsFirst-partyTencent Announces 2026 Second Quarter Results (PDF)Accessed — Q2 2026: Domestic Games RMB47.3B (+17%); International Games RMB18.6B (−0.8%, +4% constant currency).
- Sony Group (SEC EDGAR)First-partySony Group Form 20-F for the fiscal year ended 31 March 2026 (filed 18 June 2026)Accessed — G&NS sales ¥4,685,651M (prior ¥4,670,044M); operating income ¥463,258M; Bungie impairment ¥120.1B; digital software ¥2,415,305M, network services ¥763,126M, hardware & others ¥1,391,622M.
- Microsoft (SEC EDGAR)First-partyMicrosoft Form 10-K for the fiscal year ended 30 June 2026Accessed — XBOX revenue $21,790M (FY2025 $23,455M), −7%.
- NetEase (SEC EDGAR)First-partyNetEase Announces Fourth Quarter and Fiscal Year 2025 Unaudited Financial Results (Form 6-K, Exhibit 99.1)Accessed — Games and related value-added services RMB92.1B (US$13.2B) in 2025 vs RMB83.6B; online games 97.3% of the segment.
- Electronic Arts (SEC EDGAR)First-partyElectronic Arts Form 10-K for the fiscal year ended 31 March 2026Accessed — Net revenue $7,531M (+1%); net bookings $8,026M (+9%); live services $5,383M (71%); 81% of console units digital; digital full game $1,708M vs packaged $440M; Sony 39% and Microsoft 16% of net revenue.
- Electronic Arts (SEC EDGAR)First-partyEA Announces Agreement to be Acquired by PIF, Silver Lake, and Affinity Partners for $55 Billion (Form 8-K, Exhibit 99.1, 29 Sep 2025)Accessed — Enterprise value ~$55B; $210 per share in cash; “largest all-cash sponsor take-private investment in history”.
- Electronic Arts (SEC EDGAR)First-partyElectronic Arts Form 8-K: completion of the merger (4 Aug 2026)Accessed — Merger closed 4 August 2026; Nasdaq trading suspended before the open on 5 August 2026.
- NintendoFirst-partyNintendo Consolidated Financial Highlights, fiscal year ended 31 March 2026 (PDF, 8 May 2026)Accessed — Net sales ¥2,313,051M (+98.6%; prior ¥1,164,922M); Switch 2 19.86M units in the year; digital sales ¥407.6B (+25.0%).
- Roblox (SEC EDGAR)First-partyRoblox Form 10-K for the year ended 31 December 2025Accessed — Revenue $4,890.6M (+36%); bookings $6,788.4M (2024 $4,369.1M); 82% of DAUs outside US and Canada.
- Take-Two Interactive (SEC EDGAR)First-partyTake-Two Interactive Form 10-K for the fiscal year ended 31 March 2026 (filed 22 May 2026)Accessed — Net revenue $6,656.4M (+18.2%); net bookings $6,721.0M (+19.0%); RCS 78.1%; digital 97.0%; mobile 50.1%; GTA V 225M+ and GTA series 465M+ units sold in.
- Take-Two Interactive (SEC EDGAR)First-partyTake-Two Interactive Form 10-Q for the quarter ended 30 June 2026 (filed 7 Aug 2026)Accessed — “Rockstar will release Grand Theft Auto VI on November 19, 2026.”
- Take-Two Interactive (SEC EDGAR)First-partyTake-Two Interactive fourth quarter and fiscal year 2026 results release (Form 8-K, 21 May 2026)Accessed — Initial fiscal 2027 outlook: net bookings $8.0–$8.2 billion, driven by the 19 November launch of GTA VI.
- CapcomFirst-partyCapcom consolidated earnings for the year ended March 2026 (press release PDF, 13 May 2026)Accessed — Net sales ¥195,365M (+15.2%); operating profit ¥75,295M (+14.5%); 59.07M units; FY3/2027 forecast ¥210,000M.
- UbisoftFirst-partyUbisoft Reports Full-Year 2025-26 Earnings Figures (press release PDF)Accessed — Net bookings €1,525.1M (−17.4%; prior €1,846.4M); IFRS sales €1,395.7M (−21.8%); 36M MAU; Tencent transaction €1.16B cash; non-IFRS net debt €187M.
Who compiled this report
Data & Market Research Lead, Virtwave · Built and maintains this calculator
Noor runs market research for Virtwave, tracking gift card volumes, redemption patterns and fraud trends across the 80+ countries we deliver to. She compiles our data reports from primary government sources (FTC, central banks) and the major market-research houses, and cross-checks every figure against our own transaction data before publication.
Senior Gaming Commerce Editor, Virtwave · Checks every figure before an update
Rayyan covers console and PC gaming wallets for Virtwave, with deep specialism in PlayStation Network, Xbox, Razer Gold and Steam. He has been writing about digital gaming commerce since 2020.
Virtwave sells game keys and gift cards, including Steam wallet codes. No platform or publisher paid for, reviewed or approved this report.
Update history
Published 17 Oct 2026: with the ESA’s 2026 Essential Facts, its 2025 spending release (restated figures), the 2022–2025 Essential Facts reports and the 2026 Economic Impact Report, and the latest annual filings or results of Tencent (plus Q2 2026), Sony, Microsoft, NetEase, Electronic Arts, Nintendo, Roblox, Take-Two, Capcom and Ubisoft.