Industry News · Platforms statistics
PlayStation Statistics 2026: PS5 Sales, Monthly Active Users, Revenue and Digital Share
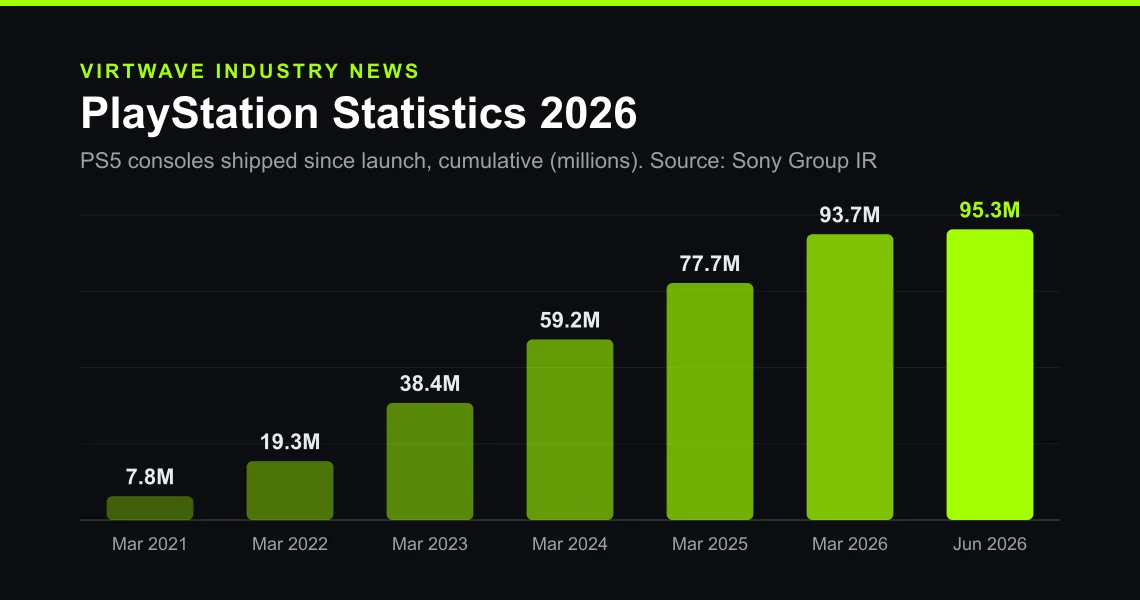
Sony had shipped 95.3 million PlayStation 5 consoles by 30 June 2026, and PlayStation had 125 million monthly active accounts that month. 82% of full games were bought as downloads in April–June 2026. Game & Network Services sales reached ¥4.69 trillion in the year to March 2026. Every figure links to the Sony document it came from.
Key takeaways
- PS5 shipments peaked at 20.8 million in the year to March 2024 and have fallen each year since, to 16.0 million in the year to March 2026.
- At the same age, 23 quarters after launch, the PS5 (95.3 million) trails the PS4 (100.1 million) by about 4.8 million consoles.
- PlayStation monthly active accounts hit a record 133 million in December 2025; the June 2026 figure, 125 million, was a record for a June.
- Sony stopped publishing PS Plus subscriber numbers after March 2023, when there were 47.4 million. Any later figure is not from Sony.
- The digital share of full-game sales has nearly doubled, from 43% in the year to March 2019 to 82% in April–June 2026.
- Add-on content (¥1.36 trillion) was the largest single revenue line in Sony’s games business in FY2025, ahead of console hardware (¥944 billion).
Key figures
95.3 million
PlayStation 5 consoles shipped since launch
Sell-in to retailers: 93.7 million by 31 March 2026 plus 1.6 million in April–June 2026. Sony’s own page rounds it to “more than 95 million”.
125 million
PlayStation monthly active users
Unique accounts that played or used online services in June 2026; up 2% year-on-year and a record for a June.
133 million
record PlayStation monthly active users
December is the seasonal high: new consoles and holiday playtime. The previous December was 129 million.
82%
of PS4 and PS5 full games bought as downloads
Share of full-game units, not revenue. A year earlier, in April–June 2025, it was 83%.
¥4,685.7 billion
Game & Network Services segment sales
Essentially flat on FY2024 (¥4,670.0 billion), and 76% higher than FY2020.
16.0 million
PS5 consoles shipped in Sony’s last full fiscal year
Down from 18.5 million in FY2024 and a peak of 20.8 million in FY2023.
47.4 million
PlayStation Plus subscribers — the last figure Sony published
Sony moved the number to a “previously disclosed” table in August 2023 and has not updated it since.
$649.99
US recommended price of a PS5 with disc drive
30% above its $499.99 launch price; the second US increase in eight months.
How many PS5 consoles have been sold?
Sony reports PS5 numbers as “sell-in”: consoles shipped to shops and distributors, not consoles bought by players. By that measure Sony had shipped 93.7 million PS5s by 31 March 2026 and 1.6 million more in April–June 2026, for 95.3 million in total. The number of consoles actually in players’ homes is lower by whatever sits in warehouses and on shelves. Sony’s last sell-through milestone was 50 million, reached on 9 December 2023.[1][3]
95.3 million
PlayStation 5 consoles shipped since launch
Sell-in to retailers: 93.7 million by 31 March 2026 plus 1.6 million in April–June 2026. Sony’s own page rounds it to “more than 95 million”.
16.0 million
PS5 consoles shipped in Sony’s last full fiscal year
Down from 18.5 million in FY2024 and a peak of 20.8 million in FY2023.
1.6 million
PS5 consoles shipped in April–June 2026
Down 36% from 2.5 million a year earlier; Sony cited the decrease in unit sales as a drag on hardware revenue.
20.8 million
PS5 consoles shipped in its best fiscal year
9.5 million
PS5 consoles shipped in its best quarter
October–December 2024. The holiday quarter carried 49% of FY2025 shipments (7.9 of 16.0 million).
50 million
PS5 consoles sold through to players
Sony’s estimate of consoles bought by consumers, reached 9 December 2023. It is the latest sell-through milestone Sony has printed.
PS5 consoles shipped since launch (cumulative sell-in)
PS5 consoles shipped per Sony fiscal year
Source: Sony Interactive Entertainment — Business Data & Sales
| Fiscal year | Q1 (Apr–Jun) | Q2 (Jul–Sep) | Q3 (Oct–Dec) | Q4 (Jan–Mar) | Full year |
|---|---|---|---|---|---|
| FY2020 | – | – | 4.5 | 3.3 | 7.8 |
| FY2021 | 2.3 | 3.3 | 3.9 | 2.0 | 11.5 |
| FY2022 | 2.4 | 3.3 | 7.1 | 6.3 | 19.1 |
| FY2023 | 3.3 | 4.9 | 8.2 | 4.5 | 20.8 |
| FY2024 | 2.4 | 3.8 | 9.5 | 2.8 | 18.5 |
| FY2025 | 2.5 | 4.0 | 7.9 | 1.5 | 16.0 |
| FY2026 | 1.6 |
Sony restated FY2025 Q2 and Q3 from 3.9 and 8.0 million to 4.0 and 7.9 million in its FY2025 Q4 supplement.
Source: Sony Interactive Entertainment — Business Data & Sales; Sony Group Corporation — Supplemental Information for the Consolidated Financial Results for the First Quarter Ended June 30, 2026
The trend is clear: PS5 shipments peaked in the year to March 2024 and have fallen for two years. Sony’s own explanation for April–June 2026 is lower unit sales, and its May 2026 outlook said FY2026 hardware sales would depend on how much memory it could buy at reasonable prices. Two US price rises in eight months, to $649.99 for the disc model, point the same way: the PS5 is now a late-cycle console, sold for profit rather than for reach.[2][4][13]
PS5 vs PS4: which sold faster?
Comparing consoles at the same age is fairer than comparing lifetime totals. Both launched in November, so their fiscal years line up exactly. The PS5 trailed the PS4 at nearly every year-end, despite starting slightly ahead, and after 23 quarters it is about 4.8 million units behind. The PS4 went on to ship more than 117 million.[10]
95.3M vs 100.1M
PS5 vs PS4 shipments 23 quarters after launch
Our sum of Sony’s quarterly sell-in tables: PS5 from October–December 2020 to April–June 2026, PS4 from October–December 2013 to April–June 2019.
More than 117 million
PlayStation 4 consoles shipped, lifetime
Sony’s quarterly table stops at 0.1 million in January–March 2022.
More than 160 million
PlayStation 2 consoles shipped, the best-selling PlayStation
| Fiscal year-end after launch | PS4 (cumulative) | PS5 (cumulative) | PS5 minus PS4 |
|---|---|---|---|
| Year 1 | 7.6 | 7.8 | +0.2 |
| Year 2 | 22.4 | 19.3 | −3.1 |
| Year 3 | 40.1 | 38.4 | −1.7 |
| Year 4 | 60.1 | 59.2 | −0.9 |
| Year 5 | 79.1 | 77.7 | −1.4 |
| Year 6 | 96.9 | 93.7 | −3.2 |
| Year 6 + one quarter | 100.1 | 95.3 | −4.8 |
The PS5 fell behind in its second year, closed most of the gap in years 3–4, then fell behind again as shipments declined.
Source: Sony Interactive Entertainment — Business Data & Sales
How many people use PlayStation?
Sony’s user number is monthly active users (MAU): unique accounts that played a game or used an online service on PlayStation in the last month of a quarter. It is an estimate from Sony’s own research, it counts accounts rather than people (one person can have several), and it covers PS4 and PS5 together. In June 2026 it was 125 million. The all-time high is 133 million, in December 2025.[1]
125 million
PlayStation monthly active users
Unique accounts that played or used online services in June 2026; up 2% year-on-year and a record for a June.
133 million
record PlayStation monthly active users
December is the seasonal high: new consoles and holiday playtime. The previous December was 129 million.
126 million
monthly active users in March 2026 (revised)
Sony said 125 million in May 2026 and revised it to 126 million in the August 2026 supplement.
+18 million
growth in March monthly active users since March 2023
From 108 million in March 2023 to 126 million in March 2026, after three flat years.
−4%
change in total PlayStation playtime, year on year
Sony attributes the drop to a strong comparison quarter with major season updates and new hits.
PlayStation monthly active users by quarter
Source: Sony Group Corporation — Supplemental Information for the Consolidated Financial Results for the Fiscal Year Ended March 31, 2025; Sony Group Corporation — Supplemental Information for the Consolidated Financial Results for the Fiscal Year Ended March 31, 2026; Sony Group Corporation — Supplemental Information for the Consolidated Financial Results for the First Quarter Ended June 30, 2026
PlayStation monthly active users each March
Source: Sony Group Corporation — Supplemental Information for the Consolidated Financial Results for the Fiscal Year Ended March 31, 2021; Sony Group Corporation — Supplemental Information for the Consolidated Financial Results for the Fiscal Year Ended March 31, 2023; Sony Group Corporation — Supplemental Information for the Consolidated Financial Results for the Fiscal Year Ended March 31, 2025; Sony Group Corporation — Supplemental Information for the Consolidated Financial Results for the First Quarter Ended June 30, 2026
The pattern repeats every year: a December peak driven by new consoles and holiday playtime, then a spring and summer dip. Comparing the same month across years removes that cycle. On that basis, PlayStation’s audience was flat from 2020 to 2023 at around 106–114 million and has grown each year since, to 126 million in March 2026. Engagement is softer than reach: total playtime fell 4% year on year in April–June 2026.[2][8]
How many PS Plus subscribers are there?
47.4 million
PlayStation Plus subscribers — the last figure Sony published
Sony moved the number to a “previously disclosed” table in August 2023 and has not updated it since.
48.0 million
peak PlayStation Plus subscribers in Sony’s disclosures
| Fiscal year | Jun | Sep | Dec | Mar |
|---|---|---|---|---|
| FY2019 | 36.2 | 36.9 | 38.8 | 41.5 |
| FY2020 | 45.0 | 45.9 | 47.4 | 47.6 |
| FY2021 | 46.3 | 47.2 | 48.0 | 47.4 |
| FY2022 | 47.3 | 45.4 | 46.4 | 47.4 |
The tiered Essential / Extra / Premium service launched during FY2022 Q1 (April–June 2022), when PlayStation Now was folded into PS Plus.
Source: Sony Group Corporation — Supplemental Information for the Consolidated Financial Results for the Fiscal Year Ended March 31, 2021; Sony Group Corporation — Supplemental Information for the Consolidated Financial Results for the Fiscal Year Ended March 31, 2023
So is PS Plus losing subscribers? Sony’s data cannot say. Subscriber numbers were flat at 45–48 million for the three years it reported them after the pandemic jump. What Sony does report, network services revenue (PS Plus plus advertising), rose from ¥383.0 billion in FY2020 to ¥763.1 billion in FY2025. Price rises and a shift to higher tiers can explain much of that, so revenue growth does not prove subscriber growth.[8][3]
Digital vs physical: how PlayStation games are bought
82%
of PS4 and PS5 full games bought as downloads
Share of full-game units, not revenue. A year earlier, in April–June 2025, it was 83%.
78%
digital share of full-game units over a full year
The highest full-year figure in Sony’s tables since FY2018; 76% in FY2024 and 43% in FY2018.
317.9 million
PS4 and PS5 full games sold (sell-in)
The most since FY2020’s 338.9 million, which included the launch and lockdown period.
32.1 million
first-party full games sold
About 10% of all full-game units on PlayStation (32.1 of 317.9 million), down from 58.4 million in FY2020.
More than 1.706 billion
PS4 and PS5 games sold, combined lifetime
Includes download-only titles, PS VR titles and software bundled with consoles.
Share of PS4 and PS5 full games bought as downloads
Source: Sony Group Corporation — Supplemental Information for the Consolidated Financial Results for the Fiscal Year Ended March 31, 2021; Sony Group Corporation — Supplemental Information for the Consolidated Financial Results for the Fiscal Year Ended March 31, 2023; Sony Group Corporation — Supplemental Information for the Consolidated Financial Results for the Fiscal Year Ended March 31, 2025; Sony Group Corporation — Supplemental Information for the Consolidated Financial Results for the Fiscal Year Ended March 31, 2026; Sony Group Corporation — Supplemental Information for the Consolidated Financial Results for the First Quarter Ended June 30, 2026
| Fiscal year | All full games | First-party titles | First-party share | Digital share |
|---|---|---|---|---|
| FY2018 | 292.7 | 54.1 | 18% | 43% |
| FY2019 | 276.1 | 49.2 | 18% | 53% |
| FY2020 | 338.9 | 58.4 | 17% | 65% |
| FY2021 | 303.2 | 43.9 | 14% | 66% |
| FY2022 | 264.2 | 43.5 | 16% | 67% |
| FY2023 | 286.4 | 39.7 | 14% | 70% |
| FY2024 | 303.3 | 28.9 | 10% | 76% |
| FY2025 | 317.9 | 32.1 | 10% | 78% |
First-party share is our division of Sony’s two columns. Sony counts only full games here: add-on content and PC sales of PlayStation Studios titles are excluded.
Source: Sony Group Corporation — Supplemental Information for the Consolidated Financial Results for the Fiscal Year Ended March 31, 2021; Sony Group Corporation — Supplemental Information for the Consolidated Financial Results for the Fiscal Year Ended March 31, 2023; Sony Group Corporation — Supplemental Information for the Consolidated Financial Results for the Fiscal Year Ended March 31, 2025; Sony Group Corporation — Supplemental Information for the Consolidated Financial Results for the Fiscal Year Ended March 31, 2026
Two things moved together. Downloads went from fewer than half of full games in FY2018 to more than four in five in April–June 2026, and the disc is now a small business: physical software brought in ¥125.1 billion in FY2025, against ¥1,055.7 billion for full-game downloads. Meanwhile Sony’s own games became a smaller slice of what PlayStation players buy: about 10% of full-game units in FY2024 and FY2025, down from 17–18% in FY2018–FY2020. PC copies of PlayStation Studios games are not counted here.[3]
Best-selling PlayStation Studios games
15.0 million
God of War Ragnarök copies sold through
PS4 and PS5, 375 days after its November 2022 release.
13.0 million
Ghost of Tsushima copies sold through, PlayStation and PC
12.0 million
Helldivers 2 copies sold, PS5 and PC combined
87 days after its February 2024 launch.
10.0 million
Marvel’s Spider-Man 2 copies sold through
PS5 only, 107 days after release; 2.5 million in its first day.
3.3 million
Ghost of Yōtei copies sold through
PS5, 32 days after its October 2025 release. Sony has published no later figure.
| Game | Platforms | Copies (million) | As of | Days after release |
|---|---|---|---|---|
| God of War (2018) | PS4, PC | 23.0* | 1 Nov 2022 | 1,656 |
| Horizon Zero Dawn | PS4, PC | 20.0* | 28 Nov 2021 | 1,734 |
| God of War Ragnarök | PS4, PS5 | 15.0 | 19 Nov 2023 | 375 |
| Marvel’s Spider-Man | PS4 | 13.2 | 28 Jul 2019 | 325 |
| Ghost of Tsushima | PS4, PS5, PC | 13.0* | 11 Aug 2024 | 1,486 |
| Helldivers 2 | PS5, PC | 12.0* | 5 May 2024 | 87 |
| Marvel’s Spider-Man 2 | PS5 | 10.0 | 4 Feb 2024 | 107 |
| Horizon Forbidden West | PS4, PS5 | 8.4 | 9 May 2023 | 445 |
| Marvel’s Spider-Man: Miles Morales | PS4, PS5 | 6.5 | 18 Jul 2021 | 249 |
| Ghost of Yōtei | PS5 | 3.3 | 2 Nov 2025 | 32 |
| Astro Bot | PS5 | 1.5 | 3 Nov 2024 | 58 |
* Combined PlayStation and PC sales. Other rows are PlayStation sales counted before any PC release.
These are Sony’s own sell-through estimates, and Sony updates them only when it chooses to, often around a milestone. That is why the God of War figure is from 2022 and the Ghost of Yōtei figure stops after a month. Treat every number here as “at least this many, on this date”. The fastest starts in the table are God of War Ragnarök (11 million in 75 days) and Helldivers 2 (12 million in 87 days across PS5 and PC).[1]
How much money does PlayStation make?
PlayStation sits in Sony’s Game & Network Services (G&NS) segment, which also includes PC releases of PlayStation games and Bungie. In the year to March 2026 the segment had sales of ¥4,685.7 billion and operating income of ¥463.3 billion. Sony reports in yen, and much of its games revenue is earned in dollars and euros, so a weaker yen inflates the yen figures: Sony put the currency boost to FY2025 sales at ¥87.3 billion.[3][4]
¥4,685.7 billion
Game & Network Services segment sales
Essentially flat on FY2024 (¥4,670.0 billion), and 76% higher than FY2020.
¥463.3 billion
Game & Network Services operating income
After ¥120.1 billion of Bungie impairments and an ¥18.3 billion development-cost correction. Excluding them, Sony says it was a record, up 45%.
¥719.8 billion
Game & Network Services adjusted OIBDA
¥120.1 billion
impairment losses on Bungie’s intangible and other assets
¥31.5 billion in July–September 2025 and ¥88.6 billion in January–March 2026.
¥937.1bn / ¥202.0bn
segment sales / operating income, April–June 2026
Sales flat year on year; operating income up 37%, helped by US tariff refunds and a weaker yen.
¥660 billion
forecast Game & Network Services operating income
Raised from ¥600 billion in May; sales forecast ¥4,540 billion. Includes rising spending on the next-generation platform.
Game & Network Services segment sales
Source: Sony Group Corporation — Supplemental Information for the Consolidated Financial Results for the Fiscal Year Ended March 31, 2021; Sony Group Corporation — Supplemental Information for the Consolidated Financial Results for the Fiscal Year Ended March 31, 2023; Sony Group Corporation — Supplemental Information for the Consolidated Financial Results for the Fiscal Year Ended March 31, 2025; Sony Group Corporation — Supplemental Information for the Consolidated Financial Results for the Fiscal Year Ended March 31, 2026
| Fiscal year | Sales | Operating income | Operating margin |
|---|---|---|---|
| FY2020 (US GAAP) | 2,656.3 | 342.2 | 12.9% |
| FY2021 | 2,739.8 | 346.1 | 12.6% |
| FY2022 | 3,644.6 | 250.0 | 6.9% |
| FY2023 | 4,267.7 | 290.2 | 6.8% |
| FY2024 | 4,670.0 | 414.8 | 8.9% |
| FY2025 | 4,685.7 | 463.3 | 9.9% |
| FY2026 forecast (Aug 2026) | 4,540 | 660 | 14.5% |
FY2025 operating income is after ¥138.4 billion of items Sony calls non-recurring (Bungie impairments and a development-cost correction).
Source: Sony Group Corporation — Supplemental Information for the Consolidated Financial Results for the Fiscal Year Ended March 31, 2021; Sony Group Corporation — Supplemental Information for the Consolidated Financial Results for the Fiscal Year Ended March 31, 2023; Sony Group Corporation — Supplemental Information for the Consolidated Financial Results for the Fiscal Year Ended March 31, 2025; Sony Group Corporation — Supplemental Information for the Consolidated Financial Results for the Fiscal Year Ended March 31, 2026; Sony Group Corporation — FY2026 Q1 Earnings Announcement — presentation slides
Where PlayStation revenue comes from
¥1,359.6 billion
add-on content sales (in-game currency, items, expansions)
29% of all segment sales and the largest single line, ahead of hardware.
¥1,055.7 billion
full-game download sales on PlayStation Store
Against ¥125.1 billion of physical software, 4.7% of game-software revenue.
¥763.1 billion
network services sales (PS Plus and advertising)
Almost double FY2020’s ¥383.0 billion, even though Sony no longer reports subscribers.
¥944.4 billion
console hardware sales
Down 17% from ¥1,132.7 billion in FY2024 as unit sales fell.
| Line | FY2024 | FY2025 | Share of FY2025 |
|---|---|---|---|
| Add-on content (in-game currency, items, expansions) | 1,340.7 | 1,359.6 | 29.0% |
| Digital software (full-game downloads) | 949.8 | 1,055.7 | 22.5% |
| Hardware (consoles) | 1,132.7 | 944.4 | 20.2% |
| Network services (PS Plus, advertising) | 669.9 | 763.1 | 16.3% |
| Others (peripherals incl. PS VR) | 359.4 | 337.1 | 7.2% |
| Physical software | 121.2 | 125.1 | 2.7% |
| Other software (first-party on other platforms) | 96.4 | 100.6 | 2.1% |
| Segment total | 4,670.0 | 4,685.7 | 100% |
Digital software and add-on content are recognised at the full PlayStation Store price, including the share Sony passes on to third-party publishers.
PlayStation is a store business more than a console business. In FY2025, full-game downloads and add-on content together brought in ¥2,415.3 billion, more than half of segment sales, while consoles brought in ¥944.4 billion and fell 17%. Because Sony books store sales at the full retail price, these lines show how much players spent on the PlayStation Store, not how much Sony kept.[3]
How much does a PS5 cost in 2026?
$649.99
US recommended price of a PS5 with disc drive
30% above its $499.99 launch price; the second US increase in eight months.
$599.99
US recommended price of the PS5 Digital Edition
50% above its $399.99 launch price.
$899.99
US recommended price of the PS5 Pro
Up from $749.99 set in August 2025.
¥97,980
Japanese recommended price of a PS5 with disc drive
Launch price was ¥49,980, so the Japanese price has nearly doubled.
$249.99
US recommended price of the PlayStation Portal remote player
| Model and market | Launch (2020) | August 2025 (US only) | From 2 April 2026 |
|---|---|---|---|
| PS5 with disc drive, US | $499.99 | $549.99 | $649.99 |
| PS5 Digital Edition, US | $399.99 | $499.99 | $599.99 |
| PS5 Pro, US | – | $749.99 | $899.99 |
| PS5 with disc drive, UK | £449.99 | – | £569.99 |
| PS5 with disc drive, Europe | €499.99 | – | €649.99 |
| PS5 with disc drive, Japan | ¥49,980 | – | ¥97,980 |
Recommended prices, not street prices. Sony gave no August 2025 change outside the US.
Source: PlayStation Blog — PlayStation 5 launches in November, starting at $399 for PS5 Digital Edition and $499 for PS5 with Ultra HD Blu-Ray Disc Drive; PlayStation Blog — PlayStation 5 price changes in the U.S.; PlayStation Blog — New Price Changes for PS5, PS5 Pro, and PlayStation Portal remote player
Consoles usually get cheaper with age. The PS5 has gone the other way: five and a half years after launch, a US disc model costs $150 more than on day one, and the Japanese price has almost doubled. Sony blamed “continued pressures in the global economic landscape” in March 2026, and its earnings materials since May 2026 discuss memory supply and prices for PS5 hardware.[13][4]
How to read Sony’s PlayStation numbers
- Sony’s fiscal year runs April to March. “FY2025” means April 2025 – March 2026, and “Q3” is the October–December holiday quarter.
- Console units are sell-in: shipped to retailers, not bought by players. Sell-through (sales to players) is published only as occasional milestones.
- Software units count PS4 and PS5 full games together, including games bundled with consoles. They exclude add-on content and PC sales.
- Monthly active users are accounts, not people, measured in the last month of each quarter, and Sony revises them.
- Revenue is in yen. When the yen weakens, PlayStation’s yen revenue rises even if dollar sales do not.
- Game & Network Services also includes PlayStation games sold on PC and other platforms, and Bungie.
Methodology and caveats
Every figure was read by our team on 11 October 2026 from a Sony document: the Supplemental Information PDFs and earnings presentations published with Sony Group’s quarterly results (FY2020 Q4 to FY2026 Q1), Sony Interactive Entertainment’s Business Data page, and PlayStation Blog posts announcing PS5 prices. Each source below links to the exact PDF or page.
Where we combined Sony’s numbers, the figure says so. That covers the 95.3 million PS5 total (93.7 million by March 2026 plus 1.6 million in April–June 2026), the PS4-vs-PS5 comparison (summed from Sony’s quarterly tables), shares of segment sales, first-party shares and operating margins. For each year we use the latest restated figure Sony has published.
Each figure carries its own period. Please quote the period with the number, especially for monthly active users, which swing by up to 14 million between a September and a December.
- PS5 units are sell-in (shipments to retailers), so the number of consoles in players’ hands is lower. Sony’s latest sell-through milestone is 50 million, from December 2023.
- Monthly active users count accounts, not people, and are Sony’s own estimates. Sony revises them: March 2026 was 125 million in May 2026 and 126 million in August 2026.
- Sony has not published PlayStation Plus subscriber numbers since March 2023 (47.4 million). We do not repeat third-party estimates for later years.
- First-party sales figures are Sony’s sell-through estimates on a date Sony chose, often years old. They are minimums, not current totals, and some combine PlayStation and PC.
- Segment figures are in yen and include PC releases and Bungie. FY2020 was reported under US GAAP, later years under IFRS, and Sony has restated some quarters since first publication.
How we research and correct our content is set out in our editorial policy.
PlayStation Statistics 2026: FAQ
How many PS5 have been sold?
Sony had shipped 95.3 million PlayStation 5 consoles to retailers by 30 June 2026: 93.7 million by 31 March 2026 plus 1.6 million in April–June 2026. Sony’s own page rounds this to “more than 95 million”. These are sell-in figures; Sony’s last count of consoles sold to players was 50 million, in December 2023.
How many people use PlayStation Network?
PlayStation had 125 million monthly active users in June 2026, according to Sony, up 2% from a year earlier. The record is 133 million, in December 2025. Sony counts unique accounts that played or used online services in the month, so the number of people is somewhat lower.
Is PS Plus losing subscribers?
Sony’s data cannot answer that, because Sony stopped publishing PS Plus subscriber numbers after March 2023, when it had 47.4 million (its peak was 48.0 million in December 2021). Network services revenue, which is mostly PS Plus, rose from ¥669.9 billion in FY2024 to ¥763.1 billion in FY2025.
Has the PS5 outsold the PS4?
Not yet. 23 quarters after launch, Sony had shipped 95.3 million PS5s against 100.1 million PS4s at the same age, a gap of about 4.8 million. The PS4 went on to ship more than 117 million, and the PlayStation 2 remains the best-selling PlayStation at more than 160 million.
What percentage of PlayStation games are bought digitally?
82% of PS4 and PS5 full-game units were bought as downloads in April–June 2026, according to Sony. Over the full year to March 2026 the share was 78%, up from 43% in the year to March 2019. Physical software brought Sony only ¥125.1 billion in FY2025.
How much money does PlayStation make?
Sony’s Game & Network Services segment had sales of ¥4,685.7 billion and operating income of ¥463.3 billion in the year to March 2026, after ¥120.1 billion of Bungie impairments. In August 2026 Sony forecast ¥660 billion of operating income for the year to March 2027.
How much does a PS5 cost in 2026?
Since 2 April 2026 Sony’s recommended US prices are $649.99 for the PS5 with a disc drive, $599.99 for the Digital Edition and $899.99 for the PS5 Pro. At launch in 2020 the PS5 cost $499.99 and the Digital Edition $399.99.
Cite or reuse these statistics
Every figure in this report is free to reuse in articles, videos, research and AI-written content under CC BY 4.0. The one condition: credit Virtwave with a link to this page, so your readers can check the number and see when it was last updated.
https://www.virtwave.com/industry-news/playstation-statistics<a href="https://www.virtwave.com/industry-news/playstation-statistics">PlayStation Statistics 2026 (Virtwave)</a>Haddad, N. (2026). PlayStation Statistics 2026. Virtwave. https://www.virtwave.com/industry-news/playstation-statisticsSources
- Sony Group CorporationFirst-partySupplemental Information for the Consolidated Financial Results for the First Quarter Ended June 30, 2026Accessed — Pages 11–12: G&NS sales breakdown, PS5 and software units, MAU, cumulative PS5 sell-in by year, first-party sell-through.
- Sony Group CorporationFirst-partyFY2026 Q1 Earnings Announcement — presentation slidesAccessed — G&NS slides: Q1 results, playtime, July 2026 forecast.
- Sony Group CorporationFirst-partySupplemental Information for the Consolidated Financial Results for the Fiscal Year Ended March 31, 2026Accessed — Pages 4 and 9–13: segment results FY2024–FY2025, non-recurring items, G&NS breakdown, PS5 sell-through milestones.
- Sony Group CorporationFirst-partyFY2025 Q4 Earnings Announcement — presentation slidesAccessed — Published May 2026. G&NS FY2025 results and FY2026 outlook.
- Sony Group CorporationFirst-partySupplemental Information for the Consolidated Financial Results for the Fiscal Year Ended March 31, 2025Accessed — FY2023–FY2024 segment results, units and MAU.
- Sony Group CorporationFirst-partySupplemental Information for the Consolidated Financial Results for the First Quarter Ended June 30, 2023Accessed — Page 10: the first “previously disclosed numbers of PlayStation Plus subscribers” table.
- Sony Group CorporationFirst-partySupplemental Information for the Consolidated Financial Results for the Fiscal Year Ended March 31, 2023Accessed — FY2021–FY2022 segment results, units, PS Plus subscribers and MAU.
- Sony Group CorporationFirst-partySupplemental Information for the Consolidated Financial Results for the Fiscal Year Ended March 31, 2021Accessed — FY2018–FY2020 G&NS results (US GAAP), units, PS Plus subscribers and MAU.
- Sony Group CorporationFirst-partyFY2026 Q2 Earnings Announcement (schedule)Accessed — Announcement dated 5 November 2026; earlier quarters are in the Earnings Releases archive.
- Sony Interactive EntertainmentFirst-partyBusiness Data & SalesAccessed — Lifetime console and software totals, and quarterly PS4 and PS5 sell-in tables.
- PlayStation BlogFirst-partyPlayStation 5 launches in November, starting at $399 for PS5 Digital Edition and $499 for PS5 with Ultra HD Blu-Ray Disc DriveAccessed — Posted 16 September 2020.
- PlayStation BlogFirst-partyPlayStation 5 price changes in the U.S.Accessed — Posted 20 August 2025; effective 21 August 2025.
- PlayStation BlogFirst-partyNew Price Changes for PS5, PS5 Pro, and PlayStation Portal remote playerAccessed — Posted 27 March 2026; effective 2 April 2026.
Who compiled this report
Data & Market Research Lead, Virtwave · Built and maintains this calculator
Noor runs market research for Virtwave, tracking gift card volumes, redemption patterns and fraud trends across the 80+ countries we deliver to. She compiles our data reports from primary government sources (FTC, central banks) and the major market-research houses, and cross-checks every figure against our own transaction data before publication.
Senior Gaming Commerce Editor, Virtwave · Checks every figure before an update
Rayyan covers console and PC gaming wallets for Virtwave, with deep specialism in PlayStation Network, Xbox, Razer Gold and Steam. He has been writing about digital gaming commerce since 2020.
Virtwave sells game keys and gift cards, including Steam wallet codes. No platform or publisher paid for, reviewed or approved this report.
Update history
Published with Sony’s FY2026 Q1 results (April–June 2026), Sony’s supplemental data back to FY2018, SIE’s Business Data page and PlayStation Blog price announcements.