Industry News · Platforms statistics
Nintendo Switch Statistics 2026: Switch 2 Sales, Switch Lifetime Units, Top Sellers and Revenue
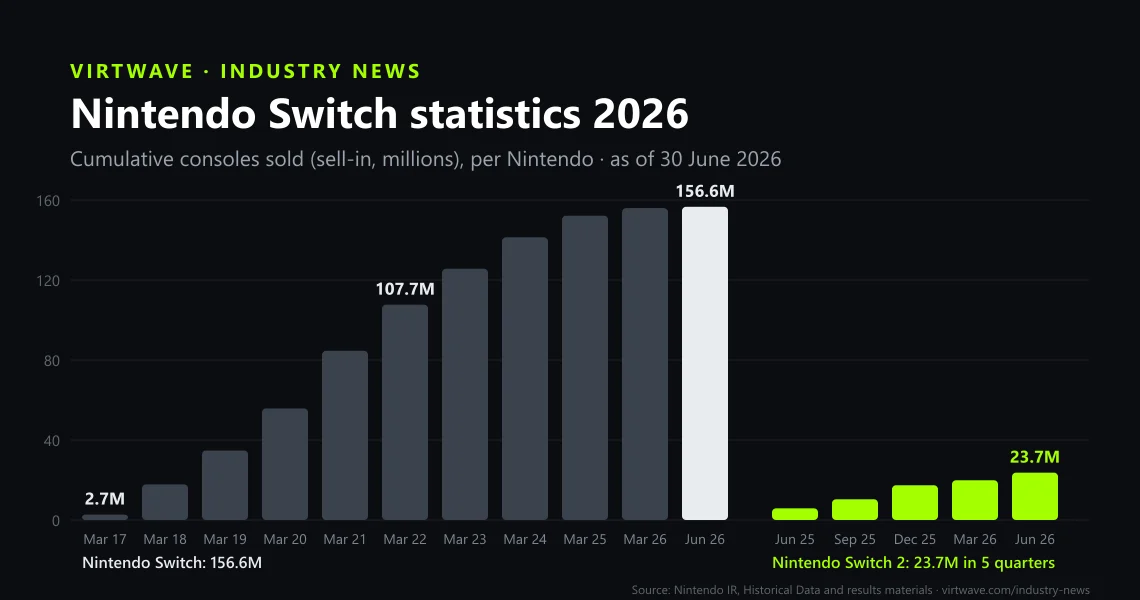
Nintendo had sold 23.68 million Nintendo Switch 2 consoles and 156.59 million original Switch consoles by 30 June 2026, its latest published count. Mario Kart 8 Deluxe is the best-selling Switch game at 71.53 million. Nintendo’s sales hit a record ¥2,313.0 billion in the year to March 2026. Every figure links to Nintendo’s own documents.
Key takeaways
- Switch 2 is selling faster than the Switch did: 23.68 million in its first five quarters against 17.79 million for the Switch over the same span.
- At 156.59 million, the Switch is Nintendo’s best-selling hardware ever, ahead of the Nintendo DS (154.02 million), but still behind Sony’s “more than 160 million” PlayStation 2.
- Mario Kart 8 Deluxe (71.53 million) and Animal Crossing: New Horizons (50.29 million) are the only Switch games past 50 million; Mario Kart World leads on Switch 2 with 15.39 million.
- The Switch 2 launch lifted Nintendo’s net sales 98.6% to a record ¥2,313.0 billion in FY3/2026, but operating margin fell to 15.6% from 24.3%, because consoles earn less than software.
- Digital sales made up 61.5% of Nintendo’s platform software sales in April–June 2026, up from 59.3% a year earlier.
- Nintendo expects Switch 2 shipments to fall to 16.50 million in the year to March 2027, after price rises in Japan (May 2026) and the US and Europe (September 2026).
Key figures
23.68 million
Nintendo Switch 2 consoles sold since launch
Sell-in, worldwide, from launch on 5 June 2025: 19.86 million in the year to March 2026 plus 3.82 million in April–June 2026.
156.59 million
Nintendo Switch consoles sold since launch
Sell-in, worldwide, since 3 March 2017. All three models: Switch, Switch OLED Model and Switch Lite.
Over 3.5 million
Switch 2 consoles sold in the first four days
Nintendo said this was the highest global sales level for any Nintendo hardware within its first four days.
71.53 million
Mario Kart 8 Deluxe copies sold, the best-selling Switch game
Includes downloads and copies bundled with consoles. Animal Crossing: New Horizons is second with 50.29 million.
¥2,313.0 billion
Nintendo net sales in the year to March 2026, a record
Up 98.6% from ¥1,164.9 billion. The previous record was ¥1,838.6 billion, in the year to March 2009.
61.5%
Digital share of Nintendo platform software sales
Up from 59.3% a year earlier. The full-year share was 54.6% in FY3/2026 and 53.5% in FY3/2025.
130 million
Annual playing users across Switch and Switch 2
Nintendo Accounts that played Switch or Switch 2 software at least once in the 12 months. A Nintendo estimate, revised retroactively.
16.50 million
Switch 2 consoles Nintendo expects to sell in the year to March 2027
Down 16.9% on the launch year. Nintendo cites unusually concentrated launch-year demand and its 2026 price rises. The forecast was left unchanged in August 2026.
How many Nintendo Switch 2 have been sold?
23.68 million
Nintendo Switch 2 consoles sold since launch
Sell-in, worldwide, from launch on 5 June 2025: 19.86 million in the year to March 2026 plus 3.82 million in April–June 2026.
Over 3.5 million
Switch 2 consoles sold in the first four days
Nintendo said this was the highest global sales level for any Nintendo hardware within its first four days.
19.86 million
Switch 2 consoles sold in its launch fiscal year
June 2025 – March 2026. Nintendo said no previous Nintendo system had reached this level in its launch year.
3.82 million
Switch 2 consoles sold in April–June 2026
Down 34.4% from 5.82 million in the launch quarter a year earlier.
7.01 million
Switch 2 consoles sold in its best quarter so far
The October–December 2025 holiday quarter, 35% of the launch year’s 19.86 million.
16.50 million
Switch 2 consoles Nintendo expects to sell in the year to March 2027
Down 16.9% on the launch year. Nintendo cites unusually concentrated launch-year demand and its 2026 price rises. The forecast was left unchanged in August 2026.
6.73 million
Switch 2 consoles sold in the Americas in the launch year
Ahead of Japan (5.66 million), Europe (4.40 million) and other regions (3.06 million).
Nintendo Switch 2 consoles sold, cumulative
Source: Nintendo Co., Ltd. — Financial Results Explanatory Material — 1st Quarter of Fiscal Year Ending March 2027; Nintendo Co., Ltd. — IR Information: Dedicated Video Game Sales Units
| Quarter | Switch 2 hardware | Switch 2 software | Switch hardware | Switch software |
|---|---|---|---|---|
| Apr–Jun 2025 | 5.82 | 8.67 | 0.98 | 24.40 |
| Jul–Sep 2025 | 4.54 | 11.95 | 0.91 | 37.17 |
| Oct–Dec 2025 | 7.01 | 17.31 | 1.36 | 47.37 |
| Jan–Mar 2026 | 2.49 | 10.79 | 0.56 | 27.98 |
| Apr–Jun 2026 | 3.82 | 9.46 | 0.66 | 33.81 |
Software includes copies bundled with hardware. Downloadable Switch 2 Editions are counted under Switch software.
Switch 2 sales are front-loaded. Nintendo says launch-year sales reached a level none of its earlier systems managed, partly because so many Switch owners upgraded at once. That is why it expects fewer Switch 2 sales in year two (16.50 million) than in year one (19.86 million), the reverse of its usual pattern. The 3.82 million in April–June 2026 was 23% of that forecast. Price rises in Japan on 25 May 2026 and in the US and Europe on 1 September 2026 will show up in the July–December numbers.[7][5][16]
Switch 2 vs Switch: sales at the same age
23.68M vs 17.79M
Switch 2 vs Switch consoles sold in their first five quarters
Our comparison from Nintendo’s tables: Switch 2 from June 2025 to June 2026, Switch from March 2017 to March 2018. Both include the partial launch quarter.
| Quarters from launch | Nintendo Switch | As of | Nintendo Switch 2 | As of |
|---|---|---|---|---|
| 1 | 2.74 | 31 Mar 2017 | 5.82 | 30 Jun 2025 |
| 4 | 14.86 | 31 Dec 2017 | 19.86 | 31 Mar 2026 |
| 5 | 17.79 | 31 Mar 2018 | 23.68 | 30 Jun 2026 |
The Switch launched on 3 March 2017, so its first quarter covers four weeks; the Switch 2 launched on 5 June 2025 and its first quarter covers about three and a half weeks. Switch at five quarters is our sum of 2.74 + 15.05 million.
Source: Nintendo Co., Ltd. — Historical Data: Consolidated Sales Transition by Region (as of March 31, 2026); Nintendo Co., Ltd. — Consolidated Financial Highlights — nine months ended December 31, 2017; Nintendo Co., Ltd. — Financial Results Explanatory Material — 1st Quarter of Fiscal Year Ending March 2027
By every cut Nintendo publishes, Switch 2 is ahead. After four quarters it had sold 5.0 million more consoles than the Switch at the same point, and after five quarters 5.9 million more. Nintendo’s sell-through charts tell the same story without numbers: Switch 2 sold more to players in its first full fiscal year than the Switch did in either of its first two, and Nintendo says its April–June 2026 sell-through compares favourably with the Switch’s early adoption.[7][5]
Nintendo Switch lifetime sales
156.59 million
Nintendo Switch consoles sold since launch
Sell-in, worldwide, since 3 March 2017. All three models: Switch, Switch OLED Model and Switch Lite.
3.80 million
Nintendo Switch consoles sold in the year to March 2026
Down 64.8% from 10.80 million a year earlier, in the system’s tenth year on sale.
0.66 million
Nintendo Switch consoles sold in April–June 2026
Down 31.8% from 0.98 million a year earlier. Nintendo forecasts 2.00 million for the full year to March 2027.
28.83 million
Switch consoles sold in its best fiscal year
April 2020 – March 2021, the first full year of the pandemic.
97.59M / 31.91M / 26.43M
Lifetime Switch sales by model: standard Switch / OLED Model / Switch Lite
Nintendo’s model split runs to 31 March 2026, when the total was 155.92 million.
59.61 million
Switch consoles sold in the Americas
38% of the 155.92 million total; Europe took 40.03 million, Japan 38.34 million and other regions 17.94 million.
Nintendo Switch consoles sold per fiscal year
Source: Nintendo Co., Ltd. — Historical Data: Consolidated Sales Transition by Region (as of March 31, 2026)
Nintendo Switch consoles sold, cumulative
Source: Nintendo Co., Ltd. — Historical Data: Consolidated Sales Transition by Region (as of March 31, 2026); Nintendo Co., Ltd. — IR Information: Dedicated Video Game Sales Units
| Model | Japan | The Americas | Europe | Other | Total |
|---|---|---|---|---|---|
| Nintendo Switch | 21.10 | 38.37 | 26.91 | 11.21 | 97.59 |
| Switch OLED Model | 10.01 | 9.48 | 7.31 | 5.10 | 31.91 |
| Switch Lite | 7.23 | 11.75 | 5.81 | 1.64 | 26.43 |
| All models | 38.34 | 59.61 | 40.03 | 17.94 | 155.92 |
The Switch Lite first appears in FY3/2020 and the OLED Model in FY3/2022.
Source: Nintendo Co., Ltd. — Historical Data: Consolidated Sales Transition by Region (as of March 31, 2026)
The Switch peaked in the pandemic year to March 2021 at 28.83 million and has declined every year since. The drop to 3.80 million in FY3/2026 is the Switch 2 transition at work: many buyers chose the successor, which plays most Switch games. The standard model accounts for 63% of lifetime units. The OLED Model sold more in Japan than anywhere else.[9]
Is the Switch the best-selling console ever?
156.59M vs 154.02M
Switch vs Nintendo DS lifetime sales
The Switch is Nintendo’s best-selling hardware ever. The Game Boy (118.69 million) and Wii (101.63 million) follow.
156.59M vs 160M+
Switch vs PlayStation 2 lifetime sales
Sony’s figure for the PS2 is “more than 160 million” as of 31 March 2012. Both are sell-in counts published by the console’s own maker.
Over 860 million
Nintendo hardware units sold across all systems
Nintendo’s own total, alongside more than 5.9 billion video games, stated in its Switch 2 launch release.
| Platform | Hardware | Software |
|---|---|---|
| Nintendo Switch | 156.59 | 1,561.95 |
| Nintendo DS | 154.02 | 948.76 |
| Game Boy | 118.69 | 501.11 |
| Wii | 101.63 | 921.85 |
| Game Boy Advance | 81.51 | 377.42 |
| Nintendo 3DS | 75.94 | 392.31 |
| Family Computer / NES | 61.91 | 500.01 |
| Super Famicom / SNES | 49.10 | 379.06 |
| Nintendo 64 | 32.93 | 224.97 |
| Nintendo Switch 2 | 23.68 | 58.17 |
| Nintendo GameCube | 21.74 | 208.58 |
| Wii U | 13.56 | 103.60 |
Source: Nintendo Co., Ltd. — IR Information: Dedicated Video Game Sales Units
The Switch is Nintendo’s best-selling system and the best-selling Nintendo software platform by a wide margin. It is not yet the best-selling console of all time. Sony’s latest PlayStation 2 figure is “more than 160 million”. Nintendo forecasts only 2.00 million more Switch consoles in the year to March 2027, which would take it to about 157.9 million, still short of 160 million.[1][17][7]
Best-selling Nintendo Switch and Switch 2 games
71.53 million
Mario Kart 8 Deluxe copies sold, the best-selling Switch game
Includes downloads and copies bundled with consoles. Animal Crossing: New Horizons is second with 50.29 million.
50.29 million
Animal Crossing: New Horizons copies sold
The second Switch game past 50 million; Super Smash Bros. Ultimate is third with 38.14 million.
15.39 million
Mario Kart World copies sold, the best-selling Switch 2 game
Includes copies bundled with the console. Donkey Kong Bananza is second with 4.78 million.
7.94 million
Tomodachi Life: Living the Dream copies sold in its first quarter
A Switch game released 16 April 2026. Nintendo put sell-through to players at more than 8 million by 5 August 2026.
1,561.95 million
Nintendo Switch games sold since launch
All publishers, packaged and downloadable versions of packaged games; download-only games are excluded. Includes downloads of Switch 2 Editions.
58.17 million
Nintendo Switch 2 games sold since launch
Includes about 12.60 million copies bundled with hardware in the launch year, such as Mario Kart World.
33.81 million
Switch games sold in April–June 2026
Up 38.6% year on year, nine years after launch, partly because Switch 2 owners buy Switch games too.
9.97
Switch games sold per Switch console
Our division of 1,561.95 million games by 156.59 million consoles. It overstates the true attach rate because Switch games played on Switch 2 are counted.
| Rank | Game | Units sold |
|---|---|---|
| 1 | Mario Kart 8 Deluxe | 71.53 |
| 2 | Animal Crossing: New Horizons | 50.29 |
| 3 | Super Smash Bros. Ultimate | 38.14 |
| 4 | The Legend of Zelda: Breath of the Wild | 34.06 |
| 5 | Super Mario Odyssey | 30.80 |
| 6 | Pokémon Scarlet / Pokémon Violet | 28.46 |
| 7 | Pokémon Sword / Pokémon Shield | 27.26 |
| 8 | The Legend of Zelda: Tears of the Kingdom | 22.71 |
| 9 | Super Mario Party | 21.36 |
| 10 | New Super Mario Bros. U Deluxe | 19.10 |
As of 30 June 2026. Includes downloadable versions and copies bundled with hardware.
Source: Nintendo Co., Ltd. — IR Information: Top Selling Title Sales Units — Nintendo Switch
| Game | Units sold | Note |
|---|---|---|
| Mario Kart World | 15.39 | Launch title, bundled with many consoles |
| Donkey Kong Bananza | 4.78 | Released July 2025 |
| Pokémon Legends: Z-A – Nintendo Switch 2 Edition | 3.99 | 13.09M with the Switch version |
| Pokémon Pokopia | 3.68 | Outside Japan only, where Nintendo publishes |
| Kirby Air Riders | 1.90 | |
| Super Mario Party Jamboree – Nintendo Switch 2 Edition | 1.15 | 11.52M with the Switch version |
As of 30 June 2026. Packaged Switch 2 Editions count here; their downloads count as Switch software.
Source: Nintendo Co., Ltd. — IR Information: Top Selling Title Sales Units — Nintendo Switch 2
Nintendo Switch games sold per fiscal year
Source: Nintendo Co., Ltd. — Historical Data: Consolidated Sales Transition by Region (as of March 31, 2026)
- Software counts include downloadable versions of packaged games but not download-only games or add-on content.
- Bundled copies count as sales: about 12.60 million Switch 2 games were bundled with hardware or other products in the launch year, Mario Kart World among them.
- Top-seller lists cover games Nintendo publishes. Third-party hits, and Pokémon games where The Pokémon Company publishes in Japan, are partly or wholly missing.
- Switch software sales rose 38.6% in April–June 2026 because Switch 2 plays Switch games. Tomodachi Life: Living the Dream, a Switch game, sold 7.94 million copies that quarter.
Nintendo revenue and profit
¥2,313.0 billion
Nintendo net sales in the year to March 2026, a record
Up 98.6% from ¥1,164.9 billion. The previous record was ¥1,838.6 billion, in the year to March 2009.
¥360.1 billion
Nintendo operating profit in the year to March 2026
Up 27.5%, but the margin fell to 15.6% from 24.3% as low-margin hardware rose to 66.7% of platform sales.
¥640.6 billion
Nintendo’s highest operating profit in the Switch era
A 36.4% margin on ¥1,758.9 billion of sales, our calculation from Nintendo’s historical data.
¥517.8bn / ¥142.5bn
Nintendo net sales / operating profit in April–June 2026
Sales down 9.5%, operating profit up 150.5%, helped by about US$300 million of refunded US IEEPA tariffs booked as lower cost of sales.
¥2,050.0 billion
Nintendo’s net sales forecast for the year to March 2027
Down 11.4%, with operating profit forecast at ¥370.0 billion (+2.7%); unchanged in August 2026.
76.9%
Share of Nintendo’s sales made outside Japan
The Americas were the largest region at 40.4% of net sales; Japan was 23.1%.
¥73.5 billion
Nintendo IP-related income (films, mobile, licensing, merchandise)
Down 9.7%. In April–June 2026 alone it reached ¥34.8 billion as The Super Mario Galaxy Movie passed US$1 billion at the box office.
Nintendo net sales per fiscal year
Source: Nintendo Co., Ltd. — Historical Data: Consolidated Statements of Income Transition (as of March 31, 2026); Nintendo Co., Ltd. — Consolidated Financial Highlights — three months ended June 30, 2026
| Fiscal year | Net sales | Operating profit | Operating margin |
|---|---|---|---|
| FY3/2017 | 489.0 | 29.3 | 6.0% |
| FY3/2018 | 1,055.6 | 177.5 | 16.8% |
| FY3/2019 | 1,200.5 | 249.7 | 20.8% |
| FY3/2020 | 1,308.5 | 352.3 | 26.9% |
| FY3/2021 | 1,758.9 | 640.6 | 36.4% |
| FY3/2022 | 1,695.3 | 592.7 | 35.0% |
| FY3/2023 | 1,601.6 | 504.3 | 31.5% |
| FY3/2024 | 1,671.8 | 528.9 | 31.6% |
| FY3/2025 | 1,164.9 | 282.5 | 24.3% |
| FY3/2026 | 2,313.0 | 360.1 | 15.6% |
| FY3/2027 forecast | 2,050.0 | 370.0 | 18.0% |
Converted from Nintendo’s million-yen figures and truncated to one decimal, as Nintendo does. Margins are our calculation.
Source: Nintendo Co., Ltd. — Historical Data: Consolidated Statements of Income Transition (as of March 31, 2026); Nintendo Co., Ltd. — Financial Results Explanatory Material (with notes) — Fiscal Year Ended March 2026; Nintendo Co., Ltd. — Consolidated Financial Highlights — three months ended June 30, 2026
Record sales did not mean record profit. In the Switch 2 launch year, hardware made up 66.7% of Nintendo’s platform sales, against 43.7% a year earlier. Nintendo says Switch 2 hardware has a lower margin than the Switch had, so gross margin fell from 61.0% to 39.3%. In April–June 2026 software’s share rose again and operating margin recovered to 27.5%. That quarter also included a one-off US tariff refund of about US$300 million. For the full year to March 2027, Nintendo has budgeted about ¥100.0 billion of extra costs from memory prices and tariffs.[7][5]
Nintendo digital sales and the download share
¥407.6 billion
Nintendo digital sales in the year to March 2026
Up 25.0%. Includes downloads of packaged games, download-only games, add-on content and Nintendo Switch Online.
61.5%
Digital share of Nintendo platform software sales
Up from 59.3% a year earlier. The full-year share was 54.6% in FY3/2026 and 53.5% in FY3/2025.
¥132.7 billion
Nintendo digital sales in April–June 2026
Up 90.0% year on year, mainly downloadable versions of packaged games, helped by a weaker yen.
74.7%
First-party share of Nintendo platform software sales
Nintendo’s own games, by value. It reached 82.6% in April–June 2026.
Nintendo digital sales per fiscal year
Source: Nintendo Co., Ltd. — Consolidated Financial Highlights — fiscal year ended March 31, 2019; Nintendo Co., Ltd. — Consolidated Financial Highlights — fiscal year ended March 31, 2021; Nintendo Co., Ltd. — Consolidated Financial Highlights — fiscal year ended March 31, 2023; Nintendo Co., Ltd. — Consolidated Financial Highlights — fiscal year ended March 31, 2024; Nintendo Co., Ltd. — Financial Results Explanatory Material (with notes) — Fiscal Year Ended March 2026
Digital share of Nintendo platform software sales, by quarter
Source: Nintendo Co., Ltd. — Financial Results Explanatory Material (with notes) — Fiscal Year Ended March 2026; Nintendo Co., Ltd. — Financial Results Explanatory Material — 1st Quarter of Fiscal Year Ending March 2027
The digital share swings with the seasons. It dips every October–December, when boxed games are bought as gifts, and peaks in January–March. Comparing like quarters, it rose from 58.9% to 59.3% to 61.5% across the last three April–June quarters. The ratio is by value, not units. Revenue from bundled games, such as the Mario Kart World console bundles, is booked as hardware, and third-party downloads count only Nintendo’s commission. So the share of games actually downloaded is not the same as this number.[7][5]
Players, subscriptions and console prices
130 million
Annual playing users across Switch and Switch 2
Nintendo Accounts that played Switch or Switch 2 software at least once in the 12 months. A Nintendo estimate, revised retroactively.
$499.99
Nintendo Switch 2 US price from 1 September 2026
Up from $449.99, before tax. In Canada it rose from $629.99 to $679.99 and on Europe’s My Nintendo Store from €469.99 to €499.99.
¥59,980
Switch 2 Japanese-language system price in Japan from 25 May 2026
Up from ¥49,980, including tax. The Switch Lite rose from ¥21,978 to ¥29,980 on the same day.
Annual playing users of Switch and Switch 2
| Market | Console | Old price | New price | Effective |
|---|---|---|---|---|
| United States | Nintendo Switch 2 | $449.99 | $499.99 | 1 Sep 2026 |
| Canada | Nintendo Switch 2 | C$629.99 | C$679.99 | 1 Sep 2026 |
| Europe (My Nintendo Store) | Nintendo Switch 2 | €469.99 | €499.99 | 1 Sep 2026 |
| Japan | Nintendo Switch 2 (Japanese-language) | ¥49,980 | ¥59,980 | 25 May 2026 |
| Japan | Nintendo Switch OLED Model | ¥37,980 | ¥47,980 | 25 May 2026 |
| Japan | Nintendo Switch | ¥32,978 | ¥43,980 | 25 May 2026 |
| Japan | Nintendo Switch Lite | ¥21,978 | ¥29,980 | 25 May 2026 |
US and Canadian prices exclude tax; Japanese and European prices include it. Nintendo Switch Online prices were also revised in Japan.
Source: Nintendo Co., Ltd. — Notice Regarding Price Revisions for Nintendo Products and Services
Methodology and caveats
Every figure was read by our team on 12 October 2026 from a Nintendo document: the IR pages for dedicated video game sales units and top-selling titles, the earnings releases and Financial Results Explanatory Material PDFs for FY3/2018 to FY3/2027 Q1, the Historical Data spreadsheets and two Nintendo news releases. The only outside figure is Sony’s own PlayStation 2 total, used for comparison. Each source below links to the exact page, PDF or spreadsheet.
Where we combined Nintendo’s numbers, the figure says so. That covers cumulative totals by quarter and fiscal year, the Switch vs Switch 2 comparison, operating margins and games sold per console. Yen figures are converted from Nintendo’s million-yen tables and truncated to one decimal, matching Nintendo’s own presentation.
The latest data is Nintendo’s April–June 2026 quarter, published on 6 August 2026. Results for July–September 2026 are scheduled for 5 November 2026, and we will update the page then.
- All unit figures are sell-in: units Nintendo sold to retailers and distributors, plus its own store and download sales. Consoles actually bought by players (sell-through) are fewer, and Nintendo publishes sell-through only as charts and occasional milestones.
- Nintendo’s fiscal year runs April to March. FY3/2026 means April 2025 – March 2026; FY3/2017 contains only the Switch’s first month.
- Packaged Switch 2 Editions count as Switch 2 software, while their downloadable versions count as Switch software. Copies bundled with consoles count as software sales, but their revenue is booked as hardware.
- Annual playing users and sell-through figures are Nintendo estimates, revised retroactively as consoles connect to the internet.
- Historical Data figures are rounded to ten thousand units, so totals we add up can differ from Nintendo’s life-to-date pages by 0.01 million.
How we research and correct our content is set out in our editorial policy.
Nintendo Switch Statistics 2026: FAQ
How many Nintendo Switch 2 have been sold?
Nintendo had sold 23.68 million Nintendo Switch 2 consoles worldwide by 30 June 2026: 19.86 million in its launch year to March 2026 and 3.82 million in April–June 2026. It sold over 3.5 million in its first four days after the 5 June 2025 launch. These are sell-in figures from Nintendo’s investor relations data.
How many Nintendo Switch consoles have been sold in total?
Nintendo had sold 156.59 million Nintendo Switch consoles by 30 June 2026, counting the standard Switch, the OLED Model and the Switch Lite. Of the 155.92 million sold by March 2026, 97.59 million were the standard model, 31.91 million the OLED Model and 26.43 million the Switch Lite.
Is the Nintendo Switch the best-selling console ever?
Not yet. At 156.59 million units by June 2026, the Switch is Nintendo’s best-selling system, ahead of the Nintendo DS at 154.02 million. Sony puts the PlayStation 2 at more than 160 million. Nintendo forecasts 2.00 million more Switch sales in the year to March 2027, which would leave it short of 160 million.
What is the best-selling Nintendo Switch game?
Mario Kart 8 Deluxe, with 71.53 million copies sold by 30 June 2026, including downloads and console bundles. Animal Crossing: New Horizons is second with 50.29 million and Super Smash Bros. Ultimate third with 38.14 million. On Switch 2, Mario Kart World leads with 15.39 million.
Is the Switch 2 selling faster than the Switch?
Yes. In its first five reporting quarters, Switch 2 sold 23.68 million units, against 17.79 million for the original Switch over its first five quarters (March 2017 – March 2018). Nintendo still expects Switch 2 sales to fall to 16.50 million in its second fiscal year, because launch demand was so concentrated.
How much money does Nintendo make?
Nintendo’s net sales were a record ¥2,313.0 billion in the year to March 2026, up 98.6%, with operating profit of ¥360.1 billion. For the year to March 2027 it forecasts ¥2,050.0 billion of sales and ¥370.0 billion of operating profit. In April–June 2026 it made ¥142.5 billion of operating profit on ¥517.8 billion of sales.
What percentage of Nintendo games are bought digitally?
Digital sales made up 61.5% of Nintendo’s platform software sales by value in April–June 2026, and 54.6% over the year to March 2026. Digital sales totalled ¥407.6 billion that year. The share is by value and excludes revenue from games bundled with consoles.
Cite or reuse these statistics
Every figure in this report is free to reuse in articles, videos, research and AI-written content under CC BY 4.0. The one condition: credit Virtwave with a link to this page, so your readers can check the number and see when it was last updated.
https://www.virtwave.com/industry-news/nintendo-switch-statistics<a href="https://www.virtwave.com/industry-news/nintendo-switch-statistics">Nintendo Switch Statistics 2026 (Virtwave)</a>Haddad, N. (2026). Nintendo Switch Statistics 2026. Virtwave. https://www.virtwave.com/industry-news/nintendo-switch-statisticsSources
- Nintendo Co., Ltd.First-partyIR Information: Dedicated Video Game Sales UnitsAccessed — Life-to-date hardware and software units for every Nintendo platform, as of 30 June 2026.
- Nintendo Co., Ltd.First-partyIR Information: Top Selling Title Sales Units — Nintendo Switch 2Accessed — Switch 2 million-sellers, as of 30 June 2026.
- Nintendo Co., Ltd.First-partyIR Information: Top Selling Title Sales Units — Nintendo SwitchAccessed — Top 10 Switch titles, as of 30 June 2026.
- Nintendo Co., Ltd.First-partyConsolidated Financial Highlights — three months ended June 30, 2026Accessed — Published 6 August 2026. Results, unit sales, digital sales and the unchanged FY3/2027 forecast.
- Nintendo Co., Ltd.First-partyFinancial Results Explanatory Material — 1st Quarter of Fiscal Year Ending March 2027Accessed — Pages 3–15: quarterly unit charts, digital sales, key ratios, sell-through and annual playing users, Super Mario Galaxy Movie box office.
- Nintendo Co., Ltd.First-partyConsolidated Financial Highlights — fiscal year ended March 31, 2026Accessed — Published 8 May 2026. Narrative of FY3/2026 results, units and digital sales.
- Nintendo Co., Ltd.First-partyFinancial Results Explanatory Material (with notes) — Fiscal Year Ended March 2026Accessed — Units, digital sales by quarter, key indicators, FY3/2027 unit forecasts, price revisions, sell-through commentary and million-seller tables.
- Nintendo Co., Ltd.First-partyHistorical Data: Consolidated Statements of Income Transition (as of March 31, 2026)Accessed — Excel file linked from the IR Historical Data page; net sales and operating profit since FY8/1981.
- Nintendo Co., Ltd.First-partyHistorical Data: Consolidated Sales Transition by Region (as of March 31, 2026)Accessed — Sheet “Nintendo Switch and after”: hardware by model and region and software units per fiscal year, in ten-thousand units.
- Nintendo Co., Ltd.First-partyConsolidated Financial Highlights — nine months ended December 31, 2017Accessed — Page 8: Switch life-to-date sales of 14.86 million at December 2017.
- Nintendo Co., Ltd.First-partyConsolidated Financial Highlights — fiscal year ended March 31, 2019Accessed — Digital sales for FY3/2018 and FY3/2019.
- Nintendo Co., Ltd.First-partyConsolidated Financial Highlights — fiscal year ended March 31, 2021Accessed — Digital sales for FY3/2020 and FY3/2021.
- Nintendo Co., Ltd.First-partyConsolidated Financial Highlights — fiscal year ended March 31, 2023Accessed — Digital sales for FY3/2022 and FY3/2023.
- Nintendo Co., Ltd.First-partyConsolidated Financial Highlights — fiscal year ended March 31, 2024Accessed — Digital sales for FY3/2024.
- Nintendo Co., Ltd.First-partyNintendo Switch 2 Sells Over 3.5 Million Units Worldwide in First Four DaysAccessed — News release dated 11 June 2025.
- Nintendo Co., Ltd.First-partyNotice Regarding Price Revisions for Nintendo Products and ServicesAccessed — News release dated 8 May 2026: Japan prices from 25 May 2026; US, Canada and Europe from 1 September 2026.
- Sony Interactive EntertainmentFirst-partyBusiness Data & SalesAccessed — Used only for the PlayStation 2 lifetime figure, which Sony publishes about its own console: more than 160 million as of 31 March 2012.
Who compiled this report
Data & Market Research Lead, Virtwave · Built and maintains this calculator
Noor runs market research for Virtwave, tracking gift card volumes, redemption patterns and fraud trends across the 80+ countries we deliver to. She compiles our data reports from primary government sources (FTC, central banks) and the major market-research houses, and cross-checks every figure against our own transaction data before publication.
Senior Gaming Commerce Editor, Virtwave · Checks every figure before an update
Rayyan covers console and PC gaming wallets for Virtwave, with deep specialism in PlayStation Network, Xbox, Razer Gold and Steam. He has been writing about digital gaming commerce since 2020.
Virtwave sells game keys and gift cards, including Steam wallet codes. No platform or publisher paid for, reviewed or approved this report.
Update history
Published 12 Oct 2026: with Nintendo’s FY3/2027 Q1 results (April–June 2026), its IR sales-unit pages, Historical Data spreadsheets, earnings releases back to FY3/2018 and the 2025–2026 news releases on Switch 2 launch sales and prices.